Using the Data Optimizer
The Data Optimizer is a powerful tool designed to enhance your data review process before reporting your CO2e emissions. This article explains the different parts of the Data Optimizer and guides you on how to navigate its user interface. For specific actions like reviewing data and fixing errors, refer to the linked articles within each section.
Main Components of the Data Optimizer
The Data Optimizer consists of the following main parts:
-
Entity Overview Tab: Provides a quick overview of your entities such as vendors and types, automatically displaying them prioritized by the largest emissions.
👉 Learn more: Entity Overview Tab
-
Review Progress: Allows you to monitor your progress in the reviewing process. The Trust Score indicates how much of your data you have reviewed.
👉 Learn more: Review Progress
-
Lines Table: The main area where you review lines based on the filters you've applied.
👉 Learn more: Lines Table
-
Error Correction: In the Errors tab, you can view and fix different types of errors that occur during data processing.
👉 Learn more: Fixing Errors
Entity Overview Tab
In the Entity Overview tab, you can quickly access your largest vendors and types.
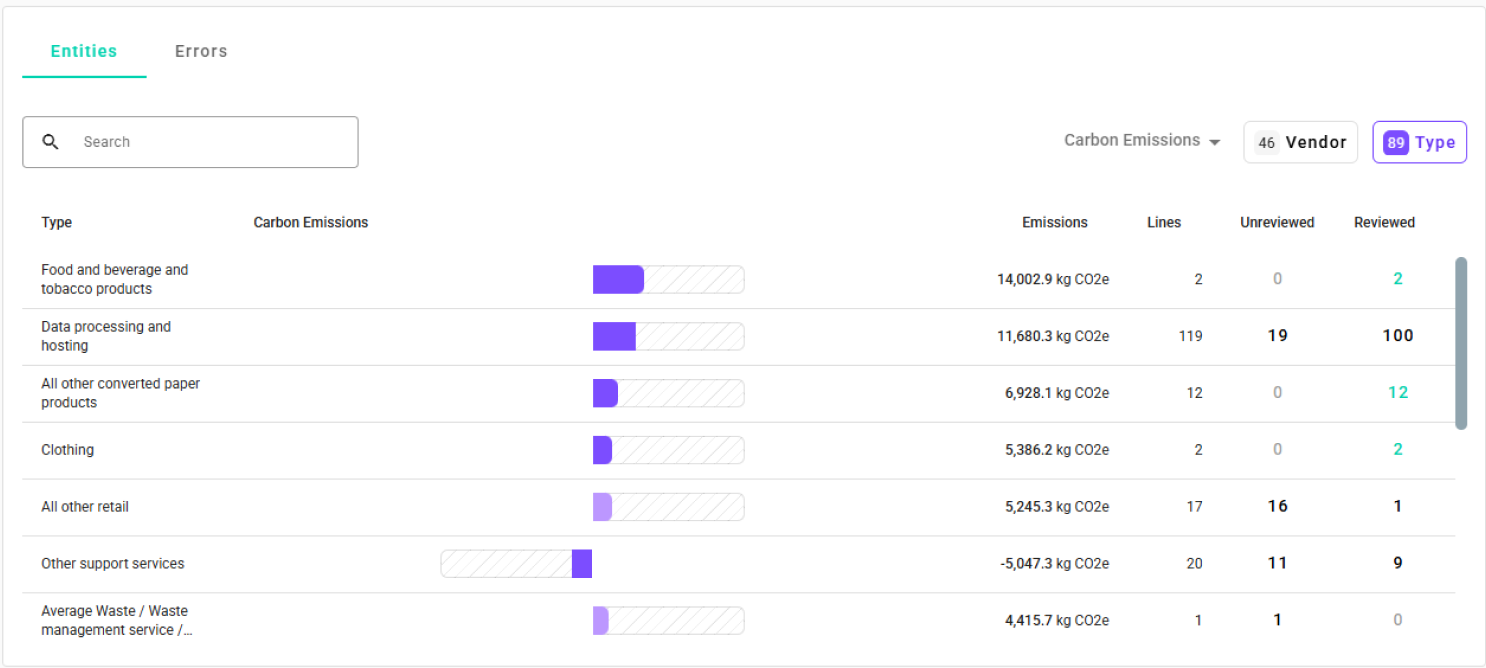
This image shows the Overview tab displaying the largest types.
Features
- Search: Find specific vendors or types using the search bar.
- Sort: Sort the list by largest or smallest emissions.
- Line Counts: See how many lines are associated with each vendor or type and how many of those lines you've reviewed.
- Load More Results: Scroll down to load additional results.
Entity Summary
The Entity Summary provides an overview of number of processed entities such as vendors and types.
- Vendors: Displays the total number of vendors in your data.
- Types: Shows the number of emission types present.

This image displays the entity Summary.
Changing Selection Criteria
- Count by Lines: You can change the selection to count by the number of lines instead of CO2e emissions. This allows you to view vendors and types that have the most lines, regardless of their emissions.
Emissions are sorted by their absolute values because large positive and negative results may be equally relevant.
Example:
- 1000 kg CO2e
- -800 kg CO2e
- 600 kg CO2e
In cases where positive and negative values offset each other, absolute sorting ensures that all significant emissions are considered.
Review Progress
The Review Progress section helps you track your progress in reviewing your data.
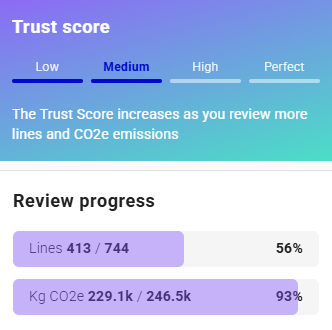
This image shows the Review Progress indicators.
Features
- Lines Reviewed: Shows the percentage and number of lines you have reviewed.
- CO2e Reviewed: Displays the percentage and amount of CO2e emissions you have reviewed.
- Trust Score: Indicates how far you are in the reviewing process. The Trust Score increases as you review more lines and CO2e emissions.
Lines Table
The Lines Table is where you review individual data lines based on your applied filters.
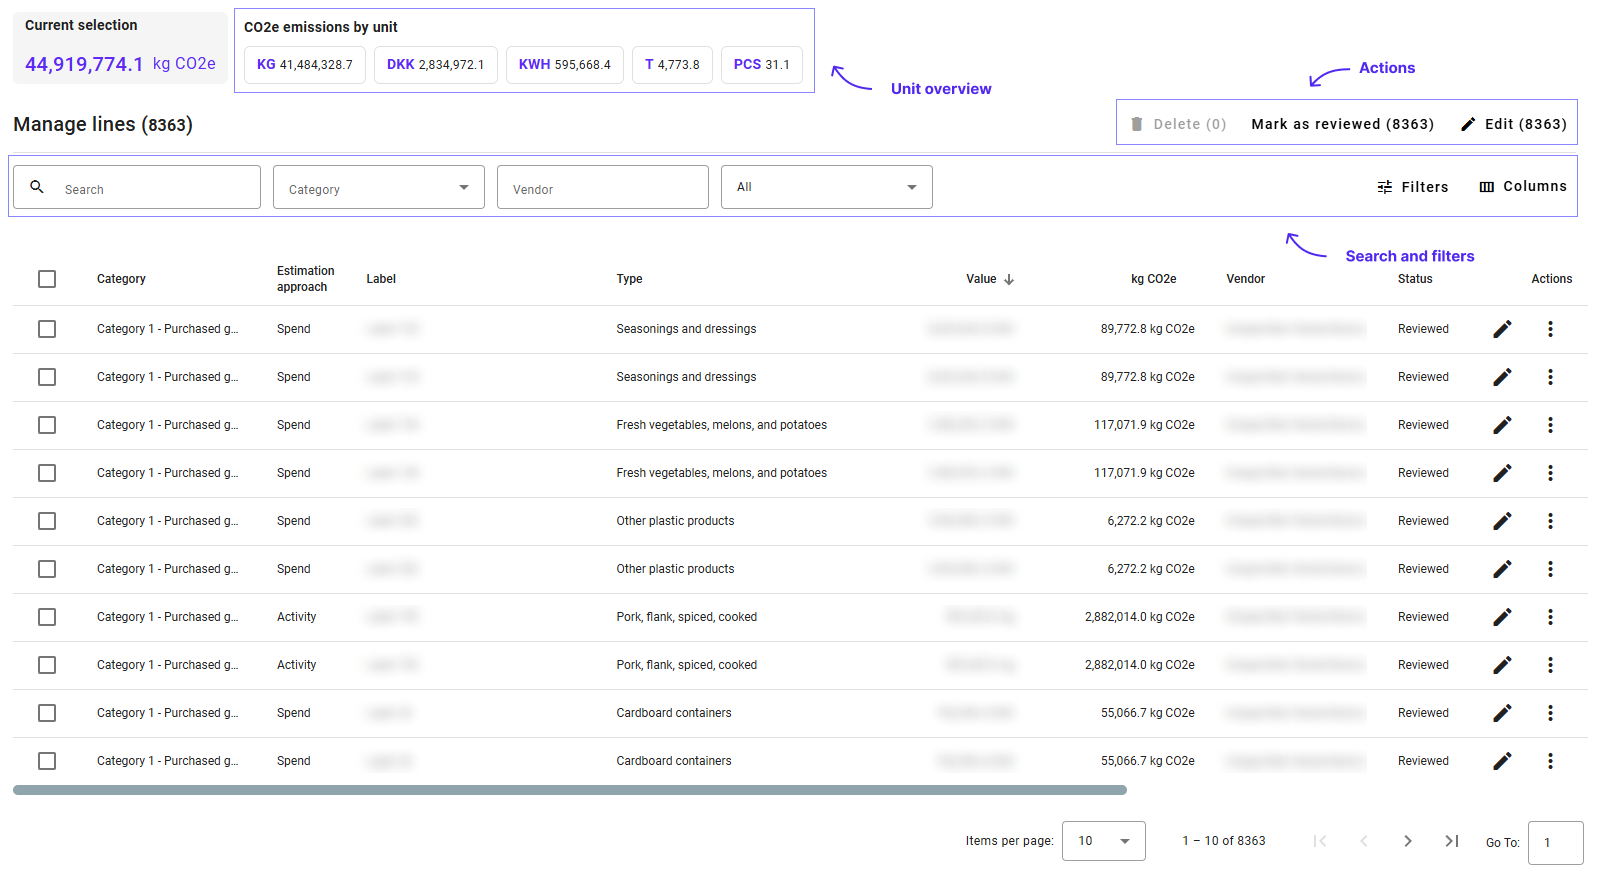
This image highlights the different sections of the Lines Table.
Components
- Total CO2e: Displays the total CO2e emissions for the current selection.
- Unit Overview: Shows how your emissions are distributed across different units (e.g., kg, liters).
- Actions:
- Edit: Modify a line's details.
- Delete: Remove a line from your data.
- Mark lines as Reviewed/Unreviewed: Indicate that you've reviewed selected lines or change them back to Unreviewed.
- Search and Filtering: Use the search bar to find specific values or apply filters, such as filtering by a vendor.
- Line Results: The list of lines that match your search and filter criteria.
Navigating the Table
- Increase Page Size: Adjust the number of lines displayed per page.
- Pagination: Move to the next or previous page of results.
Sorting Data
In addition to searching and filtering, you can sort the data in the table to organize it according to your needs.
- How to Sort:
- Click on a Table Column Header: Simply click on the header of the column you wish to sort by (e.g., Value, kg CO2e, Label, Type, Vendor).
- Ascending or Descending Order: Clicking once will sort the data in ascending order. Clicking again will sort it in descending order.
- Reset Sorting: Click the column header multiple times to cycle through ascending, descending, and reset to default order.

This image shows how to sort data by clicking on the table column headers.
Benefits of Sorting:
- Identify Largest/Smallest Values: Sorting by Value or kg CO2e helps you quickly find the largest or smallest entries.
- Organize Alphabetically: Sorting by Label, Type, or Vendor organizes data alphabetically, making it easier to locate specific entries.
- Data Analysis: Sorting allows for better data analysis by bringing the most relevant information to the top.
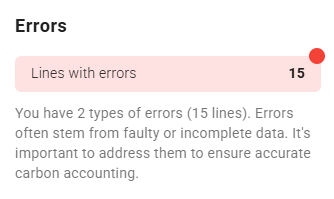
Error Correction
In the Errors tab, you can view and correct errors identified during data processing.
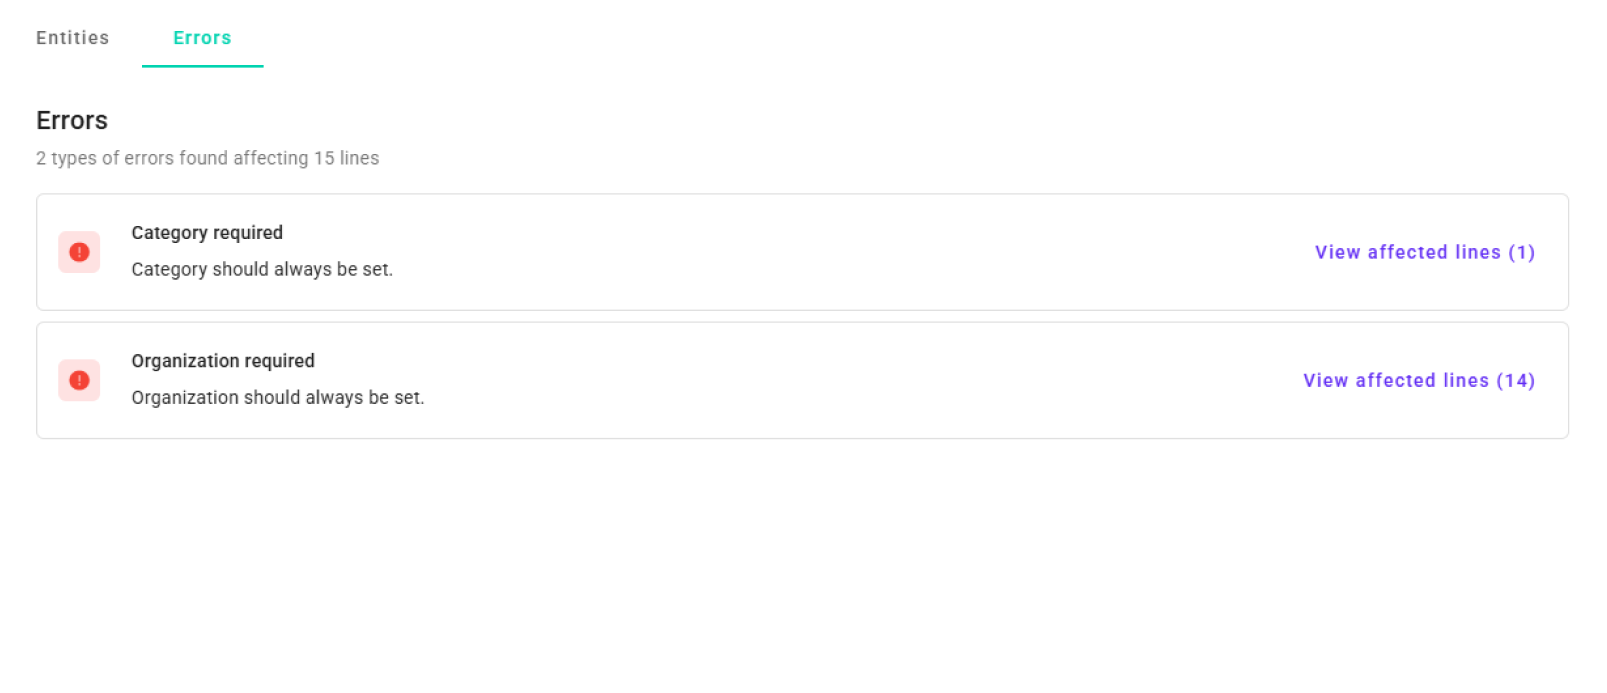
This image shows the Errors tab with grouped errors.
When you have errors in your data, you will also see a message in the review progress section indicating there are errors that should be fixed.
Features
- Grouped Errors: Errors are organized by type (e.g., lines without a value).
- View Affected Lines: Click on "View Affected Lines" to see and correct specific errors.
- Fixing Errors: Address issues directly within the Data Optimizer to ensure your data is accurate.
👉 Learn more: Fixing Errors
Navigating the User Interface
- Tabs: Use the tabs at the top to switch between the Entity Overview and Errors sections.
- Filters: Apply filters to narrow down your data based on vendors, types, units, and more.
- Search Bar: Quickly find specific data using keywords.
- Action Buttons: Utilize buttons for editing, deleting, and marking lines as reviewed.
Next Steps
With an understanding of the Data Optimizer's components, you can proceed to:
- 👉 Continue to: Reviewing Data
- 👉 Learn about: Making Changes
- 👉 Fix Issues: Fixing Errors
Need Help?
If you have any questions or need assistance using the Data Optimizer, our support team is here to help.
👉 Contact Support: Support Page
By effectively navigating and utilizing the Data Optimizer, you can streamline your data review process, ensuring that your CO2e emissions reporting is accurate and efficient.