Viewing Vouchers and Lines
In BeWo's Data Pipeline, you can view and manage your data at both the voucher and line levels. This article explains how to navigate the data table, use search and filters to find specific data, and understand the features available for vouchers and lines.
Navigating the Data Table
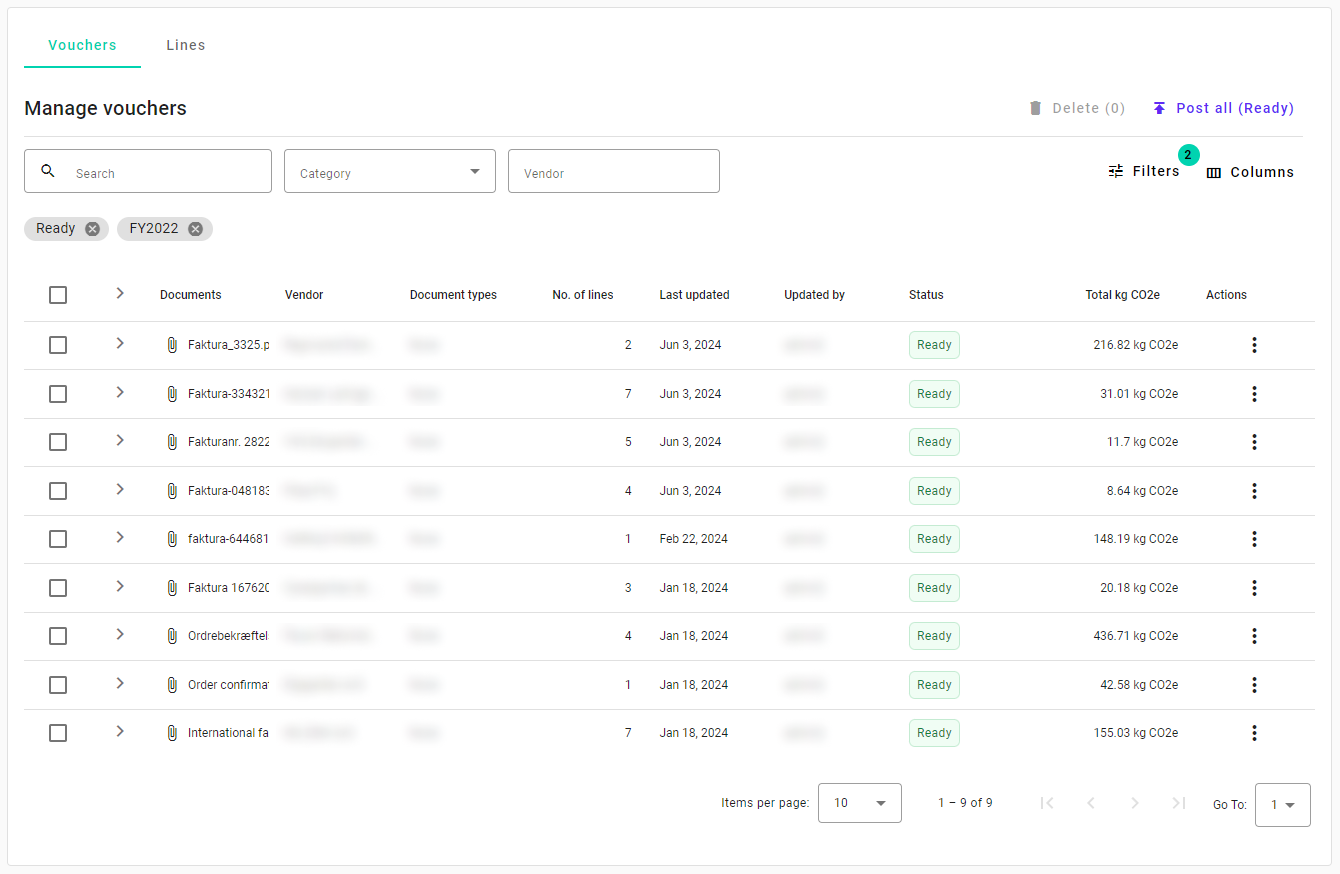
Below the Data Pipeline overview, you'll find a data table where you can switch between viewing Vouchers and Lines.
Switching Between Vouchers and Lines
- Vouchers View: Displays complete vouchers. You can expand a voucher to see the lines it contains by clicking on the expand icon.
- Lines View: Shows individual lines across all vouchers. You can open a line's voucher to see other related lines.

In this image, you can see the data table with options to switch between Vouchers and Lines.
Viewing Vouchers
When viewing vouchers:
- Expand Vouchers: Click on the arrow next to a voucher to expand it and view all associated lines.
- Voucher Details: Each voucher displays key information such as Document, Vendor, Date, Total kg CO2e for the voucher, and Processing Status.
Viewing Lines
In the Lines view:
- Individual Lines: See detailed information for each line, including Label, Type, Value, and kg CO2e.
- Open voucher: Click on a line's three dots under actions to edit/view the associated Voucher and see other associated lines.
Finding Data
To efficiently locate specific data, you can use the Search function and apply Filters.
Using the Search Bar
- Search Bar: Located at the top of the data table.
- What You Can Search For:
- Labels: Product or service descriptions.
- Types: Emission types like Electricity or Fuel.
- Vendors: Supplier names.
- Voucher Numbers: Specific voucher identifiers.
- How to Search: Enter keywords related to the data you're looking for.
The search bar allows you to find data using keywords.
Applying Filters
Primary Filters
Primary filters are readily accessible in the main header of the data table.
- Processing Status: Filter data by statuses like Ready, Posted, Errors, etc.
- Category: Narrow down data by emission categories such as Business Travel or Purchase Electricity.
- Vendor: Filter data associated with specific vendors.
More Filters
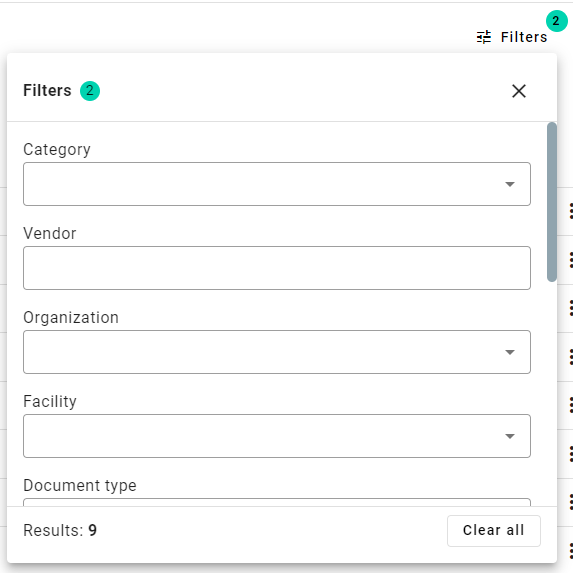
For additional filtering options, use the More Filters button (usually represented by a funnel icon or labeled "Filters").
- Available Filters:
- Organization: Select data from specific organizations within your account.
- Facility: Filter by facilities like offices or warehouses.
- Document Type: Choose data based on document types like Invoices or Receipts.
- Data Source: Filter by the integration source (e.g., ERP system).
- Reporting Year: Select data from specific reporting years.
- Estimation Approach: Filter by methods like Spend-Based or Activity-Based.
- Units: Choose data with specific units like kWh, liters, or kg.

Use the More Filters button to access additional filtering options.
For more information about what the different filters mean, refer to the Core Concepts article.
Combining Search and Filters
- Narrowing Results: You can use the search bar and filters simultaneously to refine your results.
- Example: Search for "Electricity" and filter by Processing Status "Ready" to find all ready-to-post electricity-related data.
Sorting Data
In addition to searching and filtering, you can sort the data in the table to organize it according to your needs.
- How to Sort:
- Click on a Table Column Header: Simply click on the header of the column you wish to sort by (e.g., Value, kg CO2e, Label, Type, Vendor).
- Ascending or Descending Order: Clicking once will sort the data in ascending order. Clicking again will sort it in descending order.
- Reset Sorting: Click the column header multiple times to cycle through ascending, descending, and reset to default order.
This image shows how to sort data by clicking on the table column headers.
Benefits of Sorting:
- Identify Largest/Smallest Values: Sorting by Value or kg CO2e helps you quickly find the largest or smallest entries.
- Organize Alphabetically: Sorting by Label, Type, or Vendor organizes data alphabetically, making it easier to locate specific entries.
- Data Analysis: Sorting allows for better data analysis by bringing the most relevant information to the top.
Navigating Table Pages
When dealing with large datasets, you can navigate through the data table using pagination controls.
- Switch Pages: Use the Next and Previous buttons to move between pages.
- Jump to First/Last Page: Click on the First or Last page buttons to quickly navigate.
- Adjust Items Per Page: Change the number of items displayed per page by selecting from options like 10, 25, 50, or 100.
Actions on Vouchers and Lines
- View Details: Click on a voucher or line to view detailed information.
- Edit Data: Use the Edit option (usually represented by a pencil icon) to modify data if necessary.
- Access Documents: View linked documents such as invoices or receipts by clicking on the document icons.
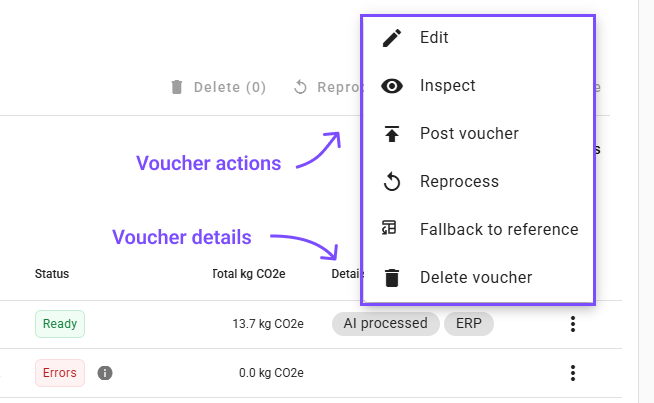
- Reprocess Voucher: Select Reprocess from the edit menu. Selected voucher will be processed again. Any changes made to the voucher will be removed.
- Fallback selected Voucher to ERP Reference: Select Fallback to reference from edit menu. Voucher will be reverted to ERP reference. This option is helpful if the documents and other additional data is not suitable for CO2e calculations.

Voucher actions
Bulk Actions on Vouchers
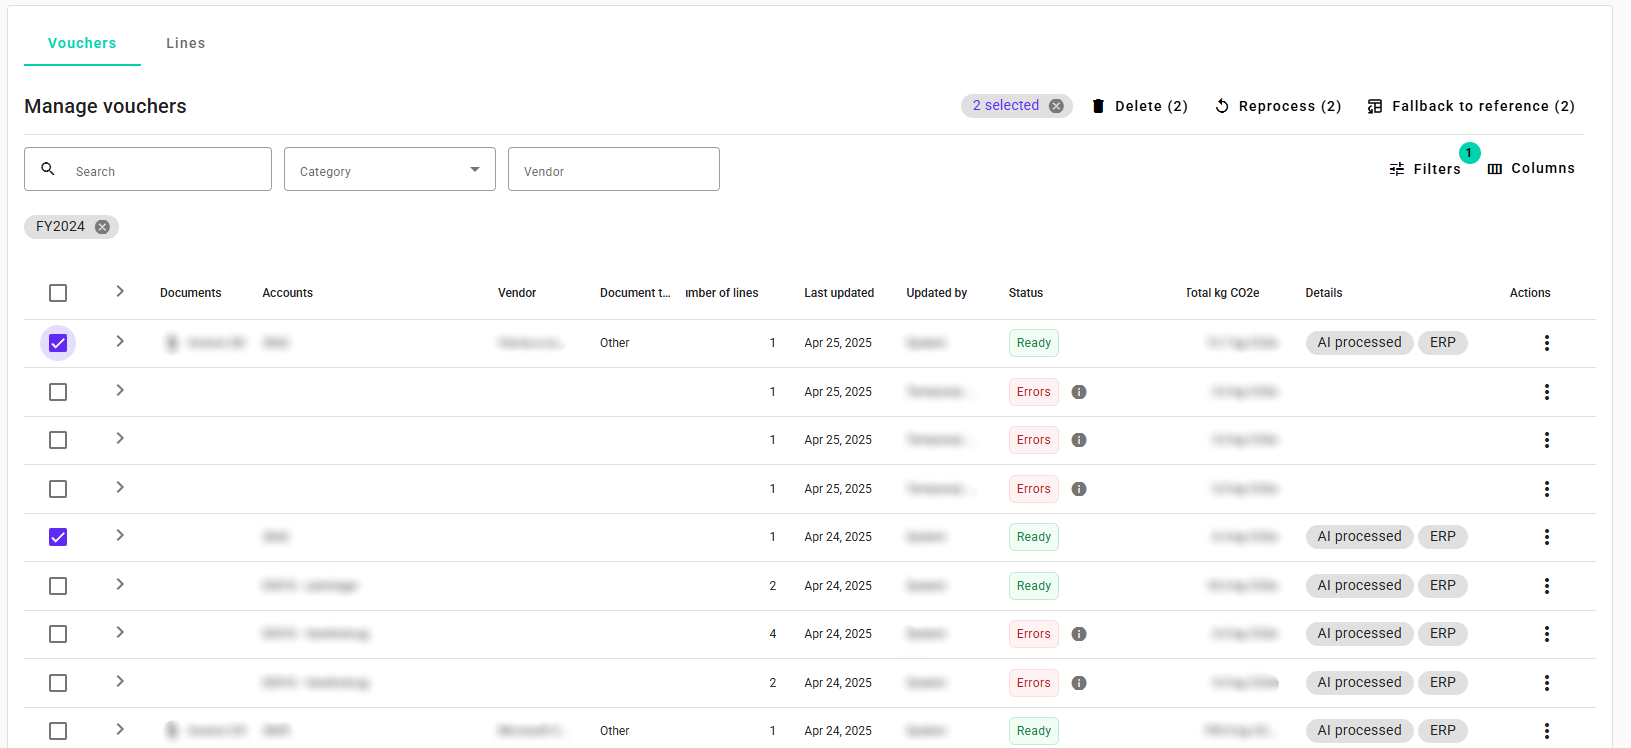
- Reprocess: Select vouchers and click Reprocess. Selected vouchers will be processed again. Your selection has to be valid - it is not allowed to reprocess vouchers created manually. Valid vouchers for repocessing are flagged as AI processed Any changes you have made to the vouchers will be removed. This option is helpful if you have made any mistakes and you want to recover selected vouchers. If you choose to continue, you will be able to find this voucher in the Data Pipeline.
- Fallback to ERP Reference: Select vouchers and click Fallback to reference. Selected vouchers will be reverted to ERP reference. You can only use this option for vouchers imported from ERP integrations, flagged as ERP. Any changes you have made to the vouchers will be removed. This option is helpful if the documents and other additional data is not suitable for CO2e calculations. If you choose to continue, you will be able to find this voucher in the Data Pipeline.
- Delete: Select vouchers and click Delete to delete multiple vouchers at once.
Details column in voucher table will help you verify which vouchers can be reprocessed or reverted to ERP reference.

Voucher bulk actions
Tips for Efficient Data Management
- Regularly Use Filters: Applying filters helps you focus on relevant data, making review and management more efficient.
- Utilize Search Functionality: When looking for specific entries, the search bar is a quick way to find them.
- Monitor Processing Statuses: Keep an eye on the processing statuses to track data readiness and address any issues promptly.
Next Steps
With an understanding of how to view and navigate vouchers and lines, you can proceed to:
- 👉 Continue to: Fixing Erorrs and Warnings
- 👉 Explore: Using the Data Optimizer
Need Help?
If you have any questions or need assistance with viewing vouchers and lines, our support team is here to help.
👉 Contact Support: Support Page
By effectively using the viewing and navigation features in BeWo's Data Pipeline, you can manage your data efficiently, ensuring accurate CO2e emissions calculations and reporting.